Reporting
Volume and score trends across your organization.
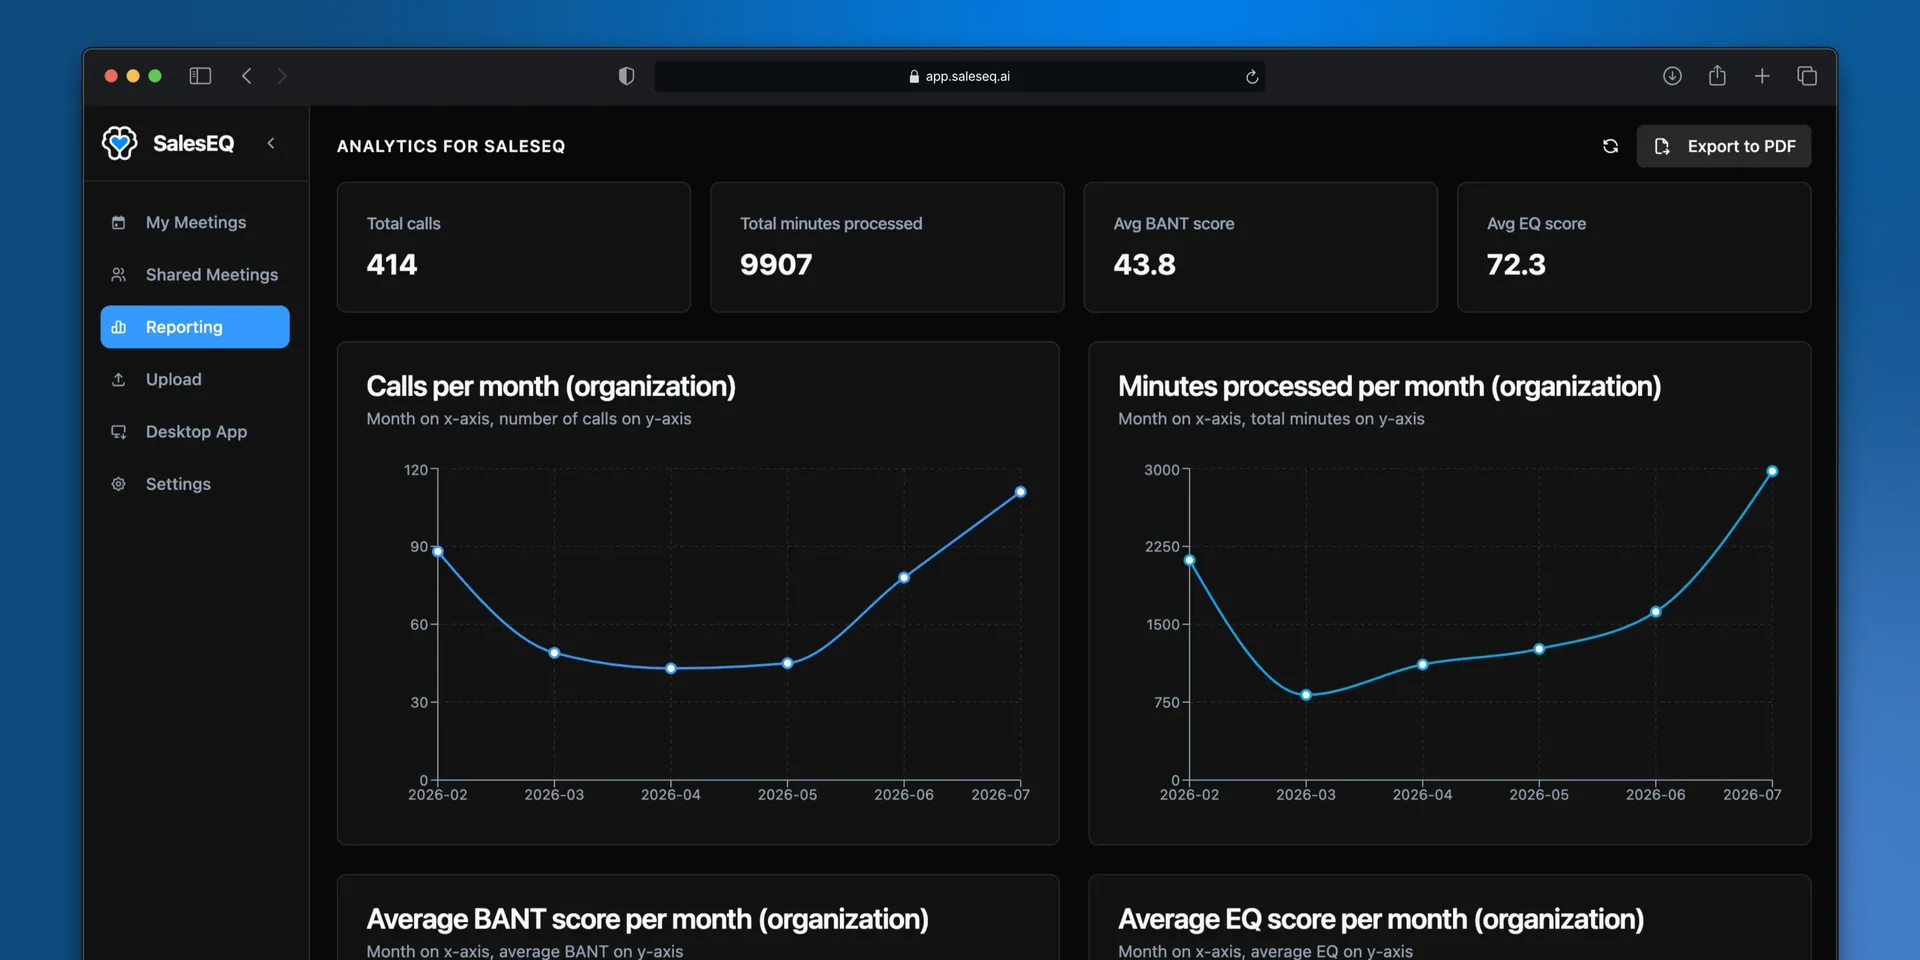
Reporting covers every meeting in the organization rather than one meeting at a time. It answers questions about volume and participation: who is recording, how much, and how that is changing.
Open Reporting in the web app. Every member can, not only admins, and everyone sees the same numbers.
What it shows
Four totals across the top: total meetings, total minutes processed, average BANT score, and average EQ score.
Below them, each of the four charted month by month, then meetings and minutes broken down by rep.
Export to PDF saves the current view.
Next
- Meeting insights covers per-meeting analysis.
- AI assistants answer questions that span many meetings.